Dashboard
The Dashboard is your central hub for monitoring UAVcast-Pro's status and your Raspberry Pi's system health. It provides real-time information about services, system resources, and network connectivity.
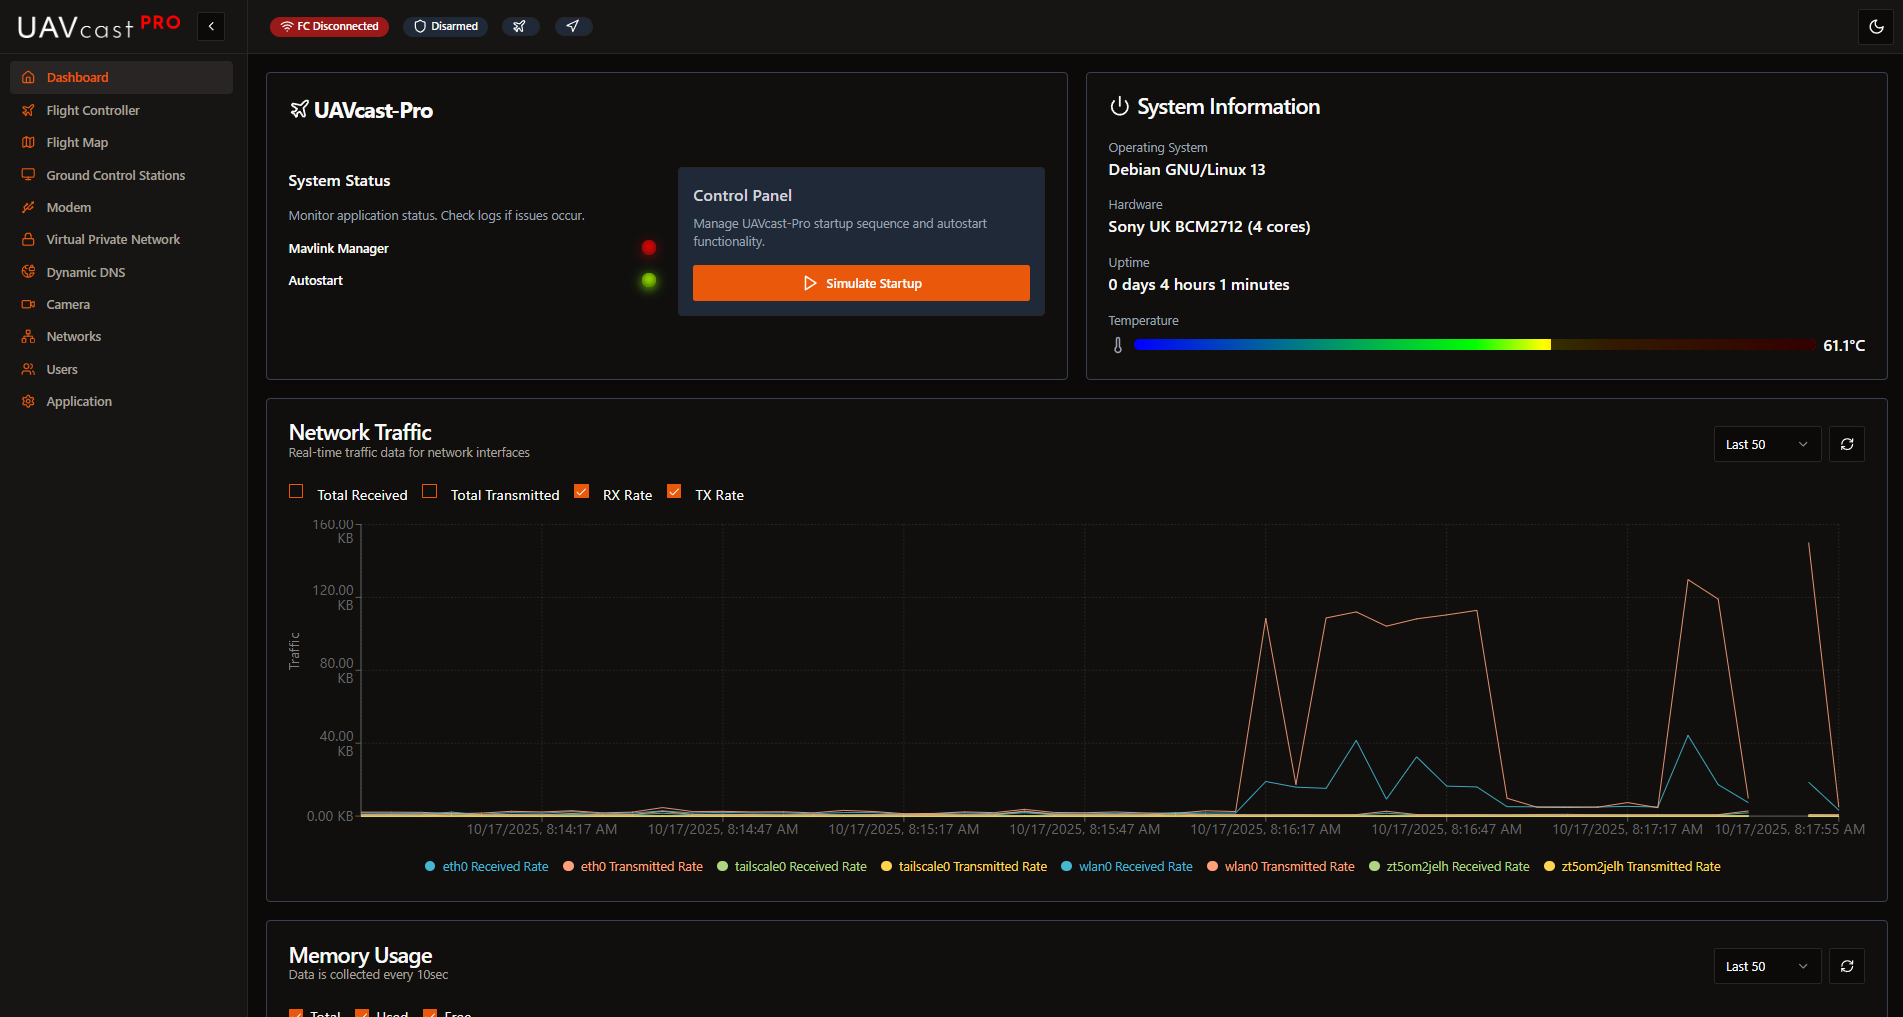
Overview
The Dashboard displays several information cards that update in real-time:
- System Information - Raspberry Pi model, OS version, and hostname
- Memory Usage - RAM utilization with percentage and available memory
- Storage - SD card usage and available disk space
- Network Statistics - Bandwidth usage for all active network interfaces
- Service Status - Real-time status of all UAVcast-Pro services
- CPU Metrics - Temperature, voltage, and throttling status
System Information Card
Displays essential system details:
- Device Model: Raspberry Pi model (e.g., Raspberry Pi 4 Model B)
- OS Version: Current Raspberry Pi OS version
- Hostname: Network hostname of your device
- Uptime: How long the system has been running
- CPU Architecture: Confirms 64-bit operation (aarch64)
Memory Usage
Real-time RAM monitoring:
- Used Memory: Current memory consumption
- Total Memory: Total available RAM
- Percentage: Memory utilization percentage
- Visual Meter: Progress bar or graph showing usage
If memory usage consistently exceeds 80%, consider:
- Closing unnecessary applications
- Disabling unused services
- Upgrading to a Raspberry Pi with more RAM
Storage Information
SD card space monitoring:
- Used Space: How much storage is consumed
- Available Space: Free space remaining
- Total Capacity: SD card size
- Percentage: Storage utilization
UAVcast-Pro requires free space for:
- Log files
- Video recordings (if enabled)
- Database operations
- System updates
Maintain at least 1GB of free space for optimal operation.
Network Statistics
Real-time bandwidth monitoring for all network interfaces:
- Interface Name: eth0 (Ethernet), wlan0 (WiFi), usb0 (Modem), zt0 (ZeroTier), etc.
- Upload Speed: Current data transmission rate
- Download Speed: Current data reception rate
- Total Uploaded: Cumulative data sent since boot
- Total Downloaded: Cumulative data received since boot
Statistics update every 10 seconds by default.
Service Status
Real-time status of UAVcast-Pro services:
Each service shows a status indicator:
- 🟢 Green: Service running normally
- 🔴 Red: Service stopped or error
- 🟡 Yellow: Service starting/stopping
CPU Metrics
Temperature Monitoring
Displays current CPU temperature with color-coded warnings:
- Green (< 60°C): Normal operation
- Yellow (60-75°C): Elevated temperature
- Orange (75-80°C): High temperature
- Red (> 80°C): Critical - throttling likely
If CPU temperature consistently exceeds 75°C:
- Ensure proper ventilation
- Add a heatsink or cooling fan
- Avoid direct sunlight
- Check case airflow
Voltage and Throttling Detection
The dashboard monitors power supply health:
- Under-voltage Detected: Power supply cannot provide sufficient voltage
- CPU Throttling: Performance reduced due to heat or power issues
Under-voltage indicates an inadequate power supply. This can cause:
- System instability
- Crashes and reboots
- SD card corruption
- Service failures
Solution: Use a quality 5V/3A power supply or UBEC. Do not power from servo rail.
Throttling Icons
- 🟢 Green: No throttling, optimal performance
- 🔴 Red: Active throttling or under-voltage detected
Next Steps
From the Dashboard, you can quickly access configuration pages:
- Flight Controller - Configure MAVLink connection
- Camera - Set up video streaming
- Ground Control Stations - Add GCS destinations
- VPN/Private Network - Configure ZeroTier or Tailscale
- Application Settings - System configuration